Browse · MATH
Printjmc
prealgebra intermediate
Problem
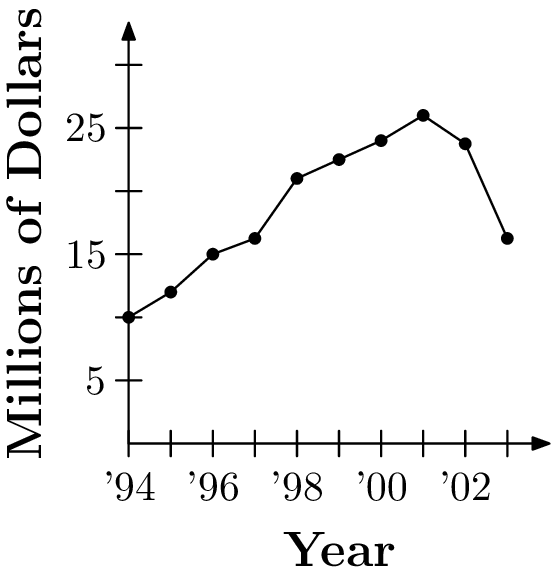
The points on this graph show the end-of-year sales amounts for each year. During what year after 1994 did sales increase the most number of dollars? Express your answer as a 4-digit year.
Solution
The chart shows the amounts of sales at the end of each year. Therefore we're looking for a year on the chart that has the largest difference from the previous year. Determining the sales that increased the most number of dollars is equivalent to finding the right endpoint of the segment with the steepest slope. From observation, we can determine that that line corresponds to the year .
Final answer
1998