Browse · harp
Printjmc
prealgebra junior
Problem
This line graph represents the price of a trading card during the first months of . 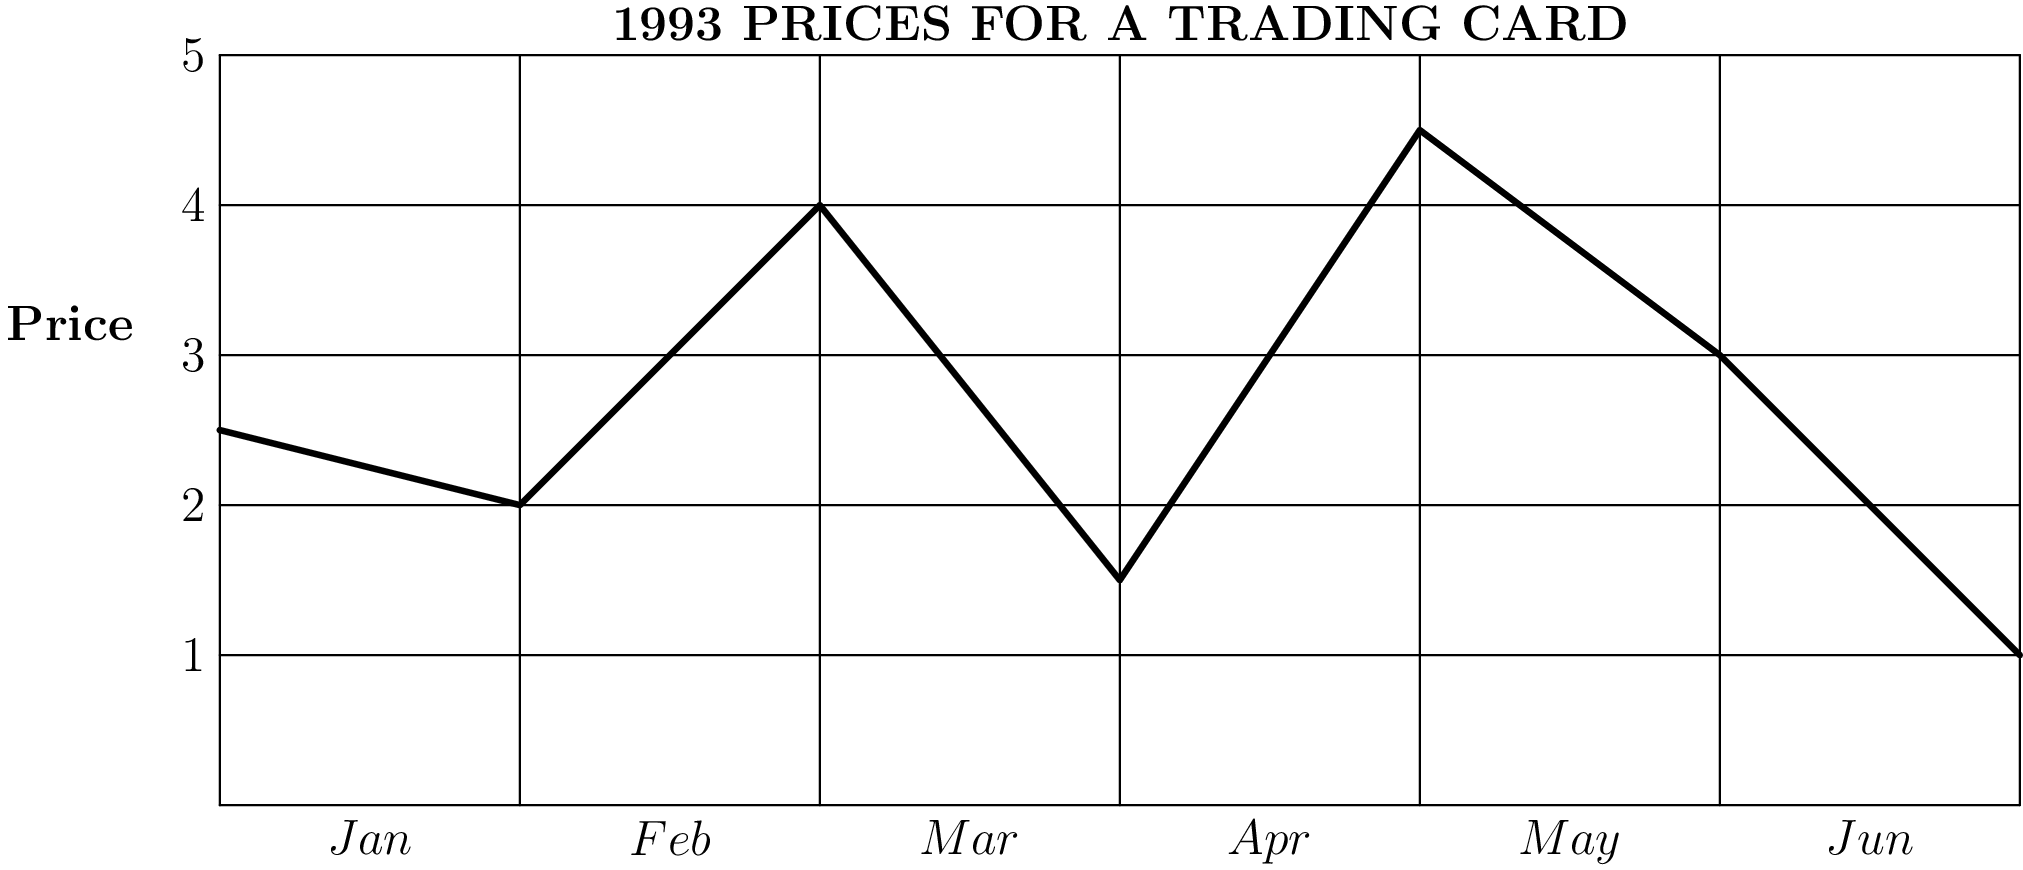 The greatest monthly drop in price occurred during
(A)
(B)
(C)
(D)
Solution
The graph shows the following price changes: Jan: Feb: Mar: Apr: May: Jun: Therefore, has the largest price drop.
Final answer
B